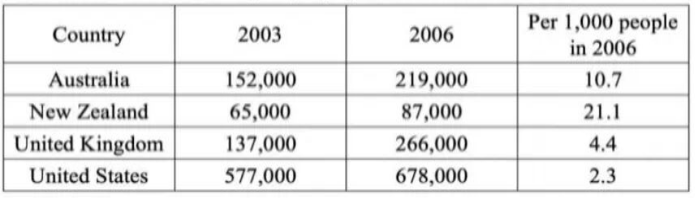
The table below shows the temporary migrant workers in four countries in 2003 and 2006 and the number of these workers per 1.000 people in these countries in 2006.
主体分段方法:按照<国家>分段
主体1:United States、New Zealand
主体2:Australia、United Kingdom
开头段
The table compares the numbers of temporary migrant workers in Australia, New Zealand, the United Kingdom and the United States in 2003 and 2006. together with the proportion of such workers per 1.000 people in 2006.
概述段
Overall, all four countries experienced a risein temporary migrant workers, with the US recording the highest figures in both years. However, Oceanian countries registered higher ratesof such workers in 2006.
思路要点:
- 四个国家临时工人数都上升
- US临时移民工人数两年都
- 澳洲国家临时移民工人比例相对较高
Body paragraph 1
The US and New Zealand showed contrasting patterns.The US recorded 577.000 temporary migrant workers in 2003. rising to678.000 in 2006. Despite this, it had the lowest proportion of such workers, at just 2.3 per 1.000 people. In contrast, New Zealand had the smallest number of migrant workersthroughout the given period, althoughits figure rose sharply from 65.000 in 2003 to 87.000 in 2006.representing the most dramatic increase among the four countries. It also had the highest proportion of temporary labor migrants, at 21.1 per 1.000 people.
思路要点:US,New Zealand
- US:2003年临时移民工人数量为577.000→2006年显著上升到678.000;但比例(2.3)
- New Zealand:临时移民工人数量始终,从2003年的65.000急剧上升到2006年的87.000.上涨幅度最显著;比例(21.1)
Body paragraph 2
Australia and the UKrecorded similar numbers of temporary migrant workers in 2003. at 152.000 and 137.000 respectively. Three years later, both countries experienced a noticeable growth, rising to 219.000 and 266.000 respectively. Regardingthe proportion of such workers, Australiaranked second in 2006 (10.7 per 1.000 people),more than twice the figure inthe UK.
思路要点:Australia, UK
- 2003年:Australia和UK临时移民工人数量相似,Australia为152.000.UK为137.000
- 2006年:两个国家都经历了显著上升,分别达到219.000和266.000
- Australia在2006年临时移民工人比例排第二(10.7), 约为UK的两倍多