分享雅思考试小作文真题范文。每一篇范文是经由专业团队反复校对,最终外教审查定稿。成功就是日复一日那一点点小小努力的积累。
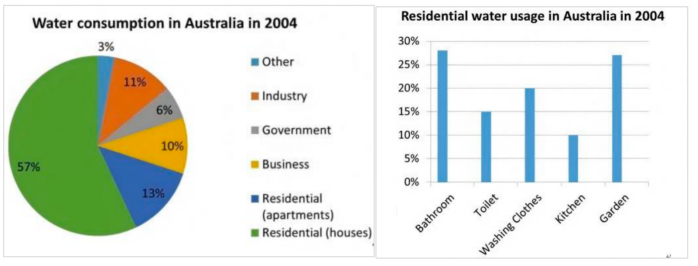
The pie and bar charts below show the percentage of water consumption and use in Australia in 2004.
主体段分段思路:
一图一段
开头段
The pie chart compares the distribution of water consumption across different sectors in Australia in 2004, while the bar chart details how residential water was utilized in the same year.
概述段
Overall, residential water usage dominated water usage in 2004, with houses using substantially more water than apartments. Within the residential sector, bathrooms and gardens were the two leading categories.
思路要点:
- 居民用水(residential)占比较高,其中houses用水远超过apartments用水
- 居民用水中,bathroom、garden用水量较高
Body paragraph 1
Regarding national water consumption, 70% of the water in Australia was utilized for residential purposes, split between 57% for houses and 13% for apartments. Industrial and business water use represented similar proportions, at 11% and 10% respectively. By contrast, a mere 6% of the water consumed nationwide went to governments, twice the figure for other purposes.
【思路要点】:饼图
- residential占比较高(70%),其中用于houses的占比为57%,apartments占比为13%
- industry、business占比相似,分别为11%和10%
- government用水占比仅为6%,是other的2倍
Body paragraph 2
Turning to household water usage, bathroom use took the lead at 28%, closely followed by garden irrigation at 27%. Laundry constituted one-fifth of the residential water consumption, surpassing toilet flushing by 5%. Conversely, kitchen activities consumed just 10% of household water, representing the smallest water-use category.
【思路要点】:柱图
- bathroom用水占比较高(28%),garden用水排第二(27%)
- washing clothes用水占比为20%,比toilet用水高5%
- kitchen用水仅为10%,占比较低