为期三讲的第二讲:
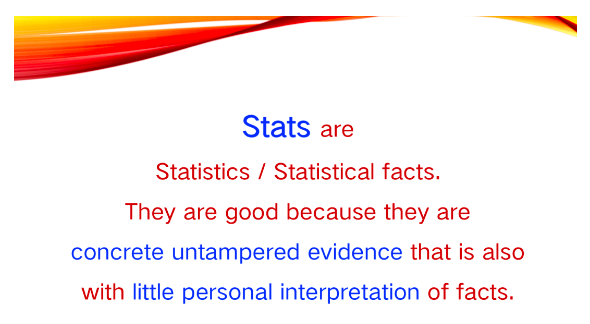
我们来解读stats
在SAT写作的材料文中是怎么肥四
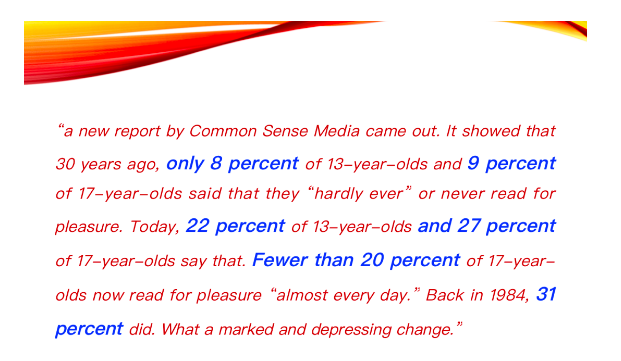
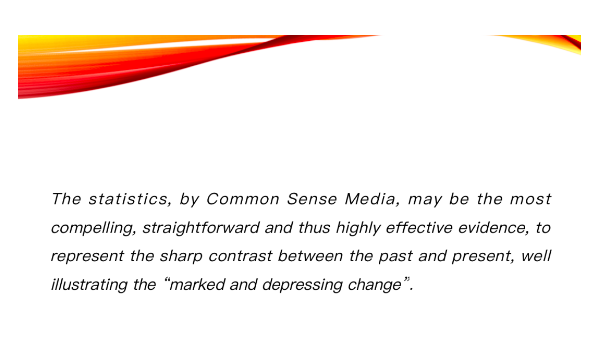
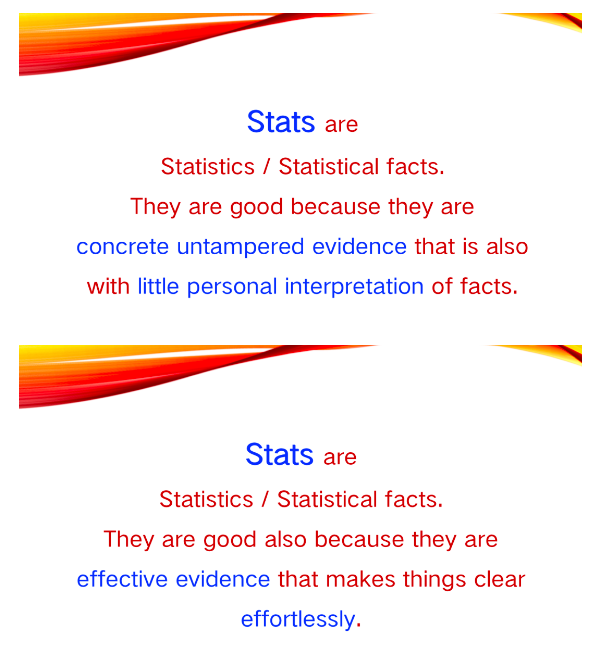
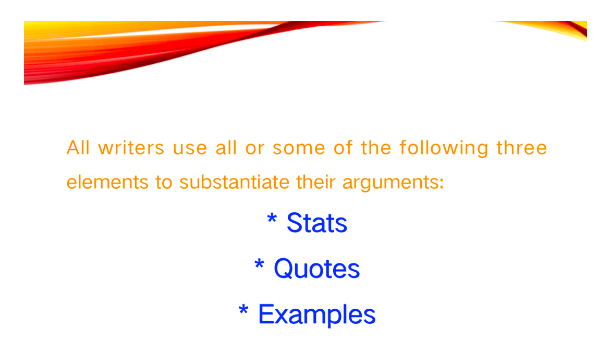
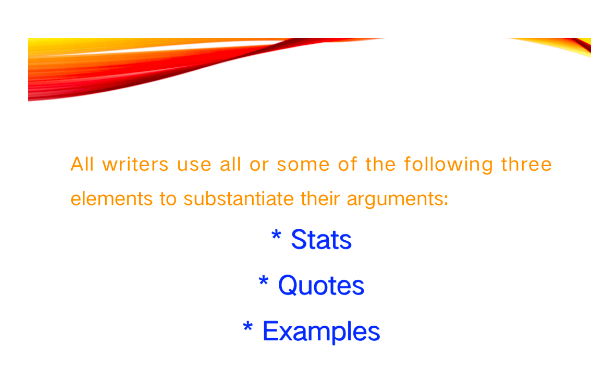
上面看完stats是什么,下面看一个实例: 文章开始不久,作者列出了几组数据: 于是,作为读者的我,看到数字就很有舒适感。 因为针对这些stats,我们的分析性写作(如下) 很容易。 再看另一篇: 文中某处,作者说到一个情况如下: 看到钱,作为读者的我,就更有舒适感了。 (可惜数目太小了) The statistics, not tampered by any of the author’s personal interpretation or emotion, are the objective indication of the legitimacy of the past increases: those increases had proven to be gradual and reasonable. The editorial board would otherwise sound like they are clamoring for a raise for the sake of clamoring, if they did not show their awareness of the statistics. 但是,随后出现了一个庞大的数目 。 因为针对这个stats,我们的分析性写作(如下) 可不是相当容易嘛。 Where people who need the increase are categorized, statistics are also the essential information on which the argument for the raise is based. With the number—3.4 million—revealed, the wide impact of the bill—that the raise would help a massive Californian low-wage population—is made obvious to the readers. 好了,我们复习一下 总结这三讲: 但是,SAT写作还有别的“玄机”么?有。那是什么?以后说。